Pride Living is pleased to present our initial insights into non-compliant and sanctioned facilities for home care, building on the Commission’s quarterly sector performance data. We have significantly increased our capability in home care to be able to provide the same quality advice we deliver in residential care.
While ACQSC sector reports provide a comprehensive analysis, our intent is not to pinpoint poor performance by the regulator or the provider. Instead, our analysis aims to complement ACQSC’s insights and publicly available data by offering practical solutions. Our goal is to assist providers in improving operations, identifying risks, and promoting good governance, ultimately enhancing your ability to deliver exceptional quality care and services.

As usual, along with our non-compliance insights, an interactive online report has been included towards the end of this insight for conducting your own analysis of the data. It’s important to note that this analysis, unlike our usual publication of residential aged care non-compliance insights, focuses on providers rather than services.

To start off, here is a summary of the regulatory landscape in home care:
There has been a significant increase in the number of quality audits conducted in accordance with ACQSC public statements regarding increased focus on Home Care compliance issues.
The number of assessment contacts is set to rise for home care providers and NATSIFAC programs. In FY22-23, the ACQSC exceeded its target of 700 assessment contacts, reaching 720, as reported in the sector report, and anticipates further growth this year.
SIRS has been in operation in home care for 1 year, starting from 1 December 2022.
Requirements for governing body membership and provider advisory bodies have now taken effect on 1 December 2023.
National Quality Indicator data has yet to be collected and published in Home Care.
Most significantly, the new Support at Home Program will be implemented from 1 July 2025, and CHSP will transition to the new program no earlier than 1 July 2027. Thus, the new reform program is still unknown.


Chart 1: Non-Compliance by Ownership
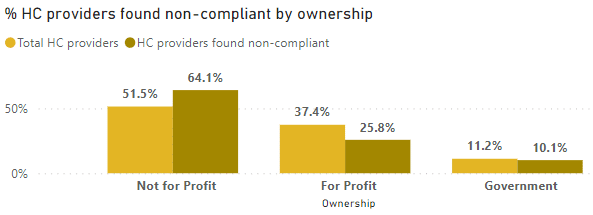
Not-for-profit operators comprise a significant portion of the non-compliances, possibly indicative of the composition of providers in the sector (52% NFP, 37% for-profit, 11% government).
However, it’s crucial to note that the number of provider representations does not directly correlate with the number of care recipient representations, as 61% of care recipients are serviced by not-for-profit providers (Department of Health and Aged Care: Financial report on the Australia Aged Care Sector 2021-2022).
Chart 2: Non-Compliance by State
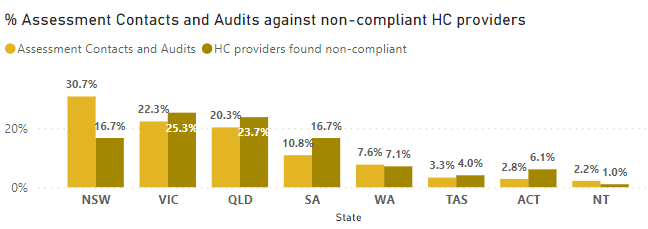
This chart provides the most interesting analysis. Please note in our disclaimer that the analysis focused on non-compliant providers by state rather than services, whereas the number of assessment contacts is based on service.
1
Highest Non-Compliance Rate:
- Victoria (VIC) has the highest non-compliance rate at 25.3%, followed closely by Queensland (QLD) at 23.7%.
- Northern Territory (NT) has the lowest non-compliance rate at 1.0%.
2
Assessment Contacts:
- New South Wales (NSW) accounts for the highest percentage of assessment contacts at 37%, indicating a significant emphasis on auditing activities in that state. This observation may be correlated with the ACQSC strategy of risk-based monitoring, suggesting a potential connection.
- Australian Capital Territory (ACT) and Tasmania (TAS) have the lowest assessment contacts at 1% and 4%, respectively.
3
Low Non-Compliance with High Assessment Contacts:
- New South Wales (NSW) stands out as a state with a relatively high non-compliance rate (16.7%) despite having the highest number of assessment contacts (37%). This may indicate that despite the high number of audits, there are still a significant number of non-compliance issues.
4
High Non-Compliance with Low Assessment Contacts:
- Conversely, Western Australia (WA) and the Australian Capital Territory (ACT) have relatively low assessment contacts (6% and 1% respectively) but also low non-compliance rates (7.1% and 6.1% respectively). This suggests that these states have a lower non-compliance risk based on the available data.
5
Consistent Non-Compliance Rates:
- South Australia (SA) and Tasmania (TAS) have the same non-compliance rate at 16.7%. Despite this similarity, SA has a lower assessment contact percentage (10% compared to TAS 4%).
Chart 3: Non-Compliance by Size
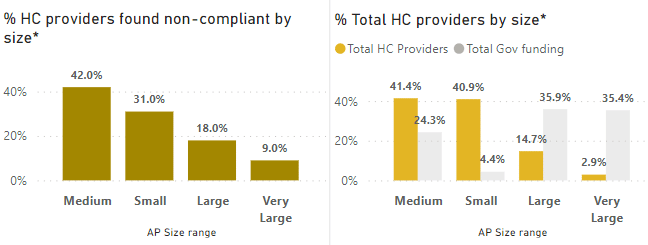
*For the purposes of our analysis, we’ve used the following categories based on FY22-23 Government funding in the GEN Aged Care Service List 2023:
Small: <$2M, Medium: $2M – $10M, Large: >$10M – $50M, Very Large: >$50M
We have also excluded CHSP and did not consolidate providers into larger economic entities.
This chart examines provider size. It’s interesting to note here that while very large providers represent 9% of the compliance issues reported in the data, they represent more than 35% market share, based on the FY22-23 Government Funding found in the GEN Aged Care Service List 2023.
Meanwhile, small and medium operators are significantly overrepresented in compliance issues when compared to the volume of services they deliver. Small operators represent a market share of 4.4%, but have recorded 31% of total compliance issues, while medium providers represent a market share of 24%, but have 42% of compliance reports. There is opportunity for small and medium providers to elevate their approach to compliance within their governance systems.
Chart 4: Non-Compliance by Standard
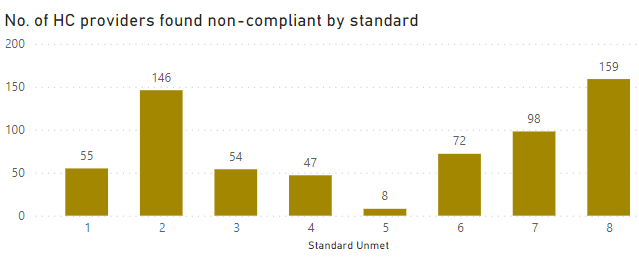
Order of rate of non-compliance by standard
![]() 1. Standard 8 – Organisational governance
1. Standard 8 – Organisational governance
![]() 2. Standard 2 – Ongoing assessment and planning with consumers
2. Standard 2 – Ongoing assessment and planning with consumers
![]() 3. Standard 7 – Human resources
3. Standard 7 – Human resources
![]() 4. Standard 6 – Feedback and complaints
4. Standard 6 – Feedback and complaints
![]() 5. Standard 1 – Consumer dignity and choice
5. Standard 1 – Consumer dignity and choice
![]() 6. Standard 3 – Personal care and clinical care
6. Standard 3 – Personal care and clinical care
![]() 7. Standard 4 – Services and supports for daily living
7. Standard 4 – Services and supports for daily living
![]() 8. Standard 5 – Organisation’s service environment
8. Standard 5 – Organisation’s service environment
In alignment with the ACQSC report, Standards 8 (Organisational Governance) and 2 (Ongoing assessment and planning with consumers) exhibit the highest rates of non-compliance. Governance themes related to systems and processes dominate the majority of identified non-compliances, underscoring the critical importance of effective systems and overall governance. In our experience, it is important for providers to note that Standard 8 is not always assessed in isolation. Non-compliances identified in Standard 8 are likely associated with non-compliances found in other Standards, particularly Standards 2 and 3 which exhibit the highest instances of non-compliance. This implies a connection indicating that governance processes are ineffective in monitoring care-related outcomes due to the identified failures.
It is not surprising that Standard 5 reports the lowest non-compliance, as very few home care providers are assessed against this standard. There appears to be limited correlation between non-compliances with Standards 7 and 1, where workforce non-compliance is linked to consumer choice. Workforce non-compliances primarily pertain to the recruitment and training of the workforce.
Chart 5: Non-Compliance by Requirement

Top 10 unmet requirements
![]() 1. 8(3)(c) – Effective governance systems
1. 8(3)(c) – Effective governance systems
![]() 2. 2(3)(a) – Assessment and planning informs safe and effective services
2. 2(3)(a) – Assessment and planning informs safe and effective services
![]() 3. 8(3)(d) – Risk management systems and practices
3. 8(3)(d) – Risk management systems and practices
![]() 4. 2(3)(e) – Regular reviews of care and services
4. 2(3)(e) – Regular reviews of care and services
![]() 5. 2(3)(b) – Assessment and planning identifies current needs
5. 2(3)(b) – Assessment and planning identifies current needs
![]() 6. 2(3)(d) – Communication of assessment and planning outcomes
6. 2(3)(d) – Communication of assessment and planning outcomes
![]() 7. 7(3)(d) – Recruitment training and support for workforce
7. 7(3)(d) – Recruitment training and support for workforce
![]() 8. 8(3)(b) – Governing body promotes safety, inclusiveness, and accountability
8. 8(3)(b) – Governing body promotes safety, inclusiveness, and accountability
![]() 9. 6(3)(d) – Feedback and complaints used to improve quality
9. 6(3)(d) – Feedback and complaints used to improve quality
![]() 10. 8(3)(e) – Clinical governance framework
10. 8(3)(e) – Clinical governance framework
Looking at the top 10 unmet requirements paints a somewhat different picture. These non-compliances appear to be related as domino effects to identified gaps in the assessment and care planning processes. This suggests that where gaps are identified in the care planning and assessment process, it predominantly relates to the lack of effective systems and overall governance.
In our opinion, the most significant barrier to home care is the maturity of the systems by providers. This is reflective of the highest non-compliance with Standard 8, specifically in 8(3)(c). This requirement interchanges with the non-compliance in 8(3)(d) in risk management systems. Our opinion is that, in the past, this has been an area lacking focus among home care providers, and only recently, with the introduction of SIRS, has there been increased attention.

Key Takeaways
1
Focus on strengthening governance for the foreseeable future, considering the forthcoming regulatory changes.
The scale of operations may be a contributing factor to non-compliances.
There is notable variation in non-compliance rates in each state, with some states facing challenges despite increased assessment contacts, while others exhibit lower non-compliance risks.
Our Recommendations
1
Prioritise an effective board with the right skill mix, especially for medium and small operators, as it may impact compliance outcomes.
For medium-sized providers remediating non-compliances, consider the size of the organisation in future strategy planning, anticipating regulatory changes.
Emphasise digital transformation for home care providers, and start collecting quality indicators as part of the clinical governance framework.

Interactive Online Report
Below is an interactive online report that allows you to conduct your own analysis:
![]()
How we can help
At last year’s ACCPA National Conference in Adelaide, Katrina Ong gave a presentation:
Directors must “trust but verify” – especially when it comes to Clinical Governance
She highlighted that:
Why choose Pride Living as your Independent Quality Auditor
According to the Hays Salary Benchmark report, a quality manager salary is from $100-150K. Our engagement is significantly less than full time wage.
All our non-compliance remediation engagements have returned to full compliance.
Our fresh set of eyes is valuable in identifying gaps that you may not be aware of. We have extensive experience working with diverse providers, therefore, we’ve encountered and addressed a wide array of scenarios your internal team might not have encountered before.
Our service has high-level integrity, which minimises the risk of an adverse outcome from either an accreditation assessment or a review.
We have restructured the service line to offer a targeted approach with minimum sampling investigation steps to keep our costs down, whilst still providing real value to give you assurance of current compliance position.
We will work with you to ensure that the clinical key risk audit reports will deliver an output tailored to provide a concise understanding of the clinical key risk areas and enable swift operational action.
We will support you to analyse the risks identified and support your executives in prioritising areas of immediate action.
Pride Living’s Compliance Assurance services include:
Key Risk Audit: We examine all 8 Standards but focus on key risk areas that are likely areas of risk to non-compliance.
Top 10 Non-Compliance Audit: We assess against the top 10 non-compliances. If this audit identifies systemic issues, it can be upgraded to our Key Risk Audit service.
To see all our Quality Management and Clinical Governance services, click here.