

In August, we published the results of our analysis of the Aged Care Financial Performance Survey (ACFPS) and the Quarterly Financial Snapshot of the Aged Care Sector (QFS) of residential care, which highlighted some significant drivers of performance and dismissed the myth that care funding is determinative of financial performance. In this Insight, we consider the drivers of performance of home care providers.

 The reality
The ACFPS suggests the average home care organisation is generating an operating result of 4.9% of revenue (7.2% in the QFS which has a more comprehensive dataset). The average top quartile performance is 14.6%.
Top quartile organisations are nearly THREE times as profitable as average organisations.
While these averages look respectable, the figures mask a number of issues that are important from a sustainability perspective. The QFS indicates that 21.6% of providers are unprofitable. The average profitability (7.2%) means that half the industry is forgoing significant profit due to poor management of their basic business processes.
To put this in perspective, we recently worked with a large Not for profit organisation and the gap between their actual performance and that of the average first quartile was a staggering $10 million annually.
There are many “rules of thumb” on what percentage profit/surplus is required for viability and sustainability. Experience tells us that if an organisation:
With the home care reform program well underway, and the likely outcome being a move towards commoditising service delivery, we predict most organisations will experience shrinking margins. Those organisations in the bottom half of the dataset are likely to see most of their margin evaporate. Those making losses will go further into deficit. This is consistent with our observations on viability.
If you want to be successful, you should imitate the successful players. With this in mind, we analysed the key factors of participants in the ACFPS to understand the interactions that high performers get right so that our readers can improve their operating performance and sustainability.

Every governing body should be continually testing the executive team as to whether they have the right business model and whether this business model is delivering a sustainable result. For providers who offer both home care and residential services, we often see limited understanding of the key drivers within the home care business. Often, this lack of focus is because critical residential care problems are consuming the board’s time. Given the gap between top and average performance of home care providers for many multi-disciplinary businesses, improving home care results truly is low hanging fruit to boost overall organisational performance!
 The drivers of financial outcome in home care
As with most endeavours, there are a small set of critical success factors that top-quartile performers focus on.
The following chart shows the areas that contribute to overall profitability. From this, we distilled four significant areas that when given appropriate focus make the difference between being average and being a star performer.
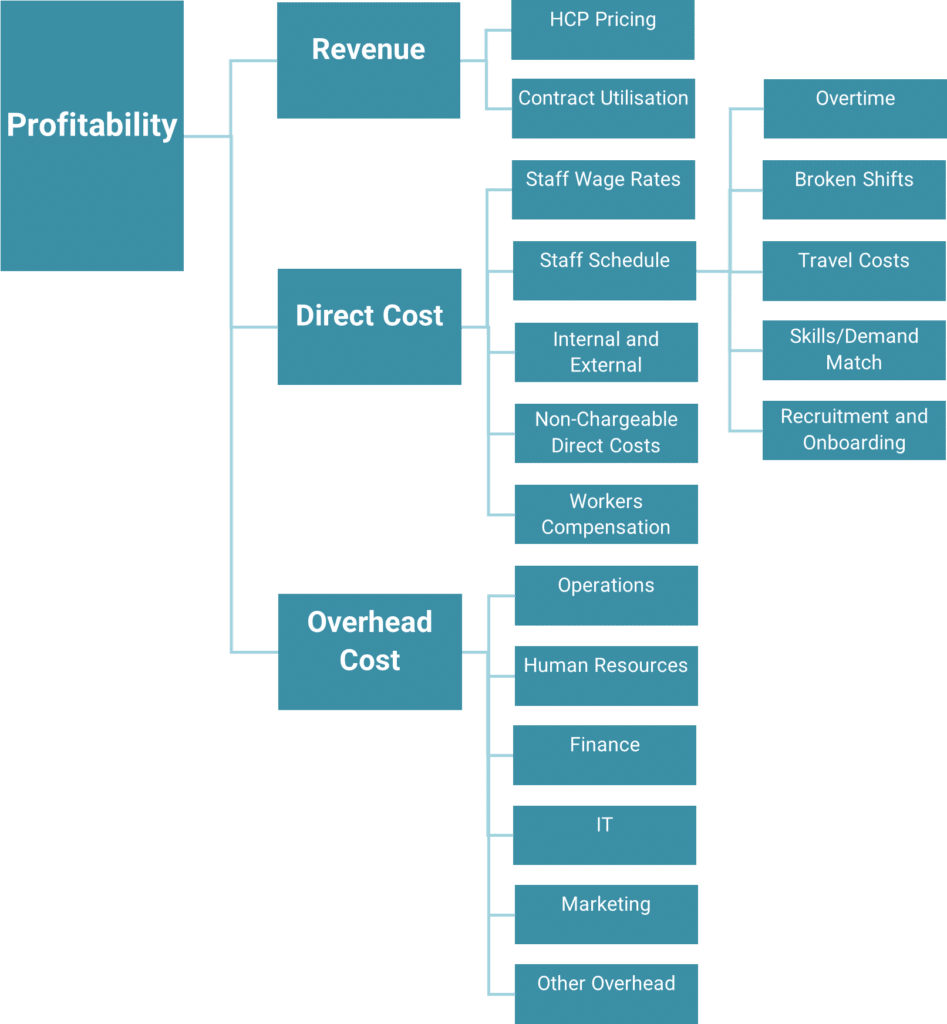
The four key drivers are:

1. A strong compliance system and culture
Compliance problems become a major distraction for organisations when trying to manage performance into the future, not to mention the human cost and risk that can be created by underperformance in this area.

2. A robust sales and marketing function
According to the ACFPS, the average organisation loses around 30% of their clients each year to death, residential care and competitors. These need to be replaced and onboarded if the organisation is not to suffer a reduction in revenue. Organisations need to have a good handle on their marketing channels, and a good business system for identifying potential clients and onboarding them.

3. A sound scheduling engine
The scheduling process in home care organisations are central to their financial results. Gross margins for home care packages sit around 45% in the top quartile, indicating that the scheduling team controls at least 55% of an organisation’s recurrent revenue. In spite of this, schedulers are comparatively low paid employees who create the operating result on a minute-by-minute basis. These staff are under constant pressure from clients and staff, and tend not to be well supported by leadership, business intelligence or policy and process.

3. Efficient business processes to manage overheads
As most other functions across the organisation support the scheduling department, a best practice scheduling model tends to lower other costs through reduction of rework, automation of process and efficient problem solving.
 What the ACFPS and QFS tell us
Having a sustainable home care service is far more about how the team within your organisation performs, than it is about the level of subsidy you receive. Let’s look at the evidence that we found to support this view.
Table 1 shows the difference in revenue per client per day (pcpd).

The All-Organisations group has a higher level of revenue per client per day (pcpd) than the average of the top 50% despite having lower profitability and only $0.95 less than the top quartile providers. Clearly, gross margin is not driven by the revenue being generated on a per client basis.
Table 2 shows the difference in package utilisation among the groups.

Contract utilisation percentages are remarkably similar across all groups.
Given the diversity in gross margin and the consistency of package utilisation and revenue per client per day, the driver in the difference in performance is found in the organisation’s structure.
Table 3 summarises the difference in the key cost areas across the three benchmarked groups.

The difference in financial outcome relates to:
While the headline data points to a significant difference in overhead, most of the difference is explained by the difference in internal corporate recharges (11.4% for the all-organisation group compared to 7.7% for the top quartile group).
The difference between the average organisation in the top quartile and the top 50% group indicates a significant and rapid decline in gross margin for all but the top quartile and to a lesser extent a rapid decline in efficiency in care management activities.
Consider what your organisation could do with an additional $1 million! Would you invest in more training, IT systems, culture programs, or funds to subsidise charitable pursuits?
 Operating margin and scheduling
Given this, we’ve decided to focus on initiatives that can improve operating margin in this Insight, as this has multiple benefits:
Achieving the benefits is about business processes and it starts with Scheduling!
Unlike the complex issues facing the residential sector where there are significant capital costs involved and large projects to be undertaken, home care’s problems are a comparatively simple fix.
In our experience, large numbers of organisations are underinvesting in their scheduling departments. This includes leadership, training, culture and technology. The consequence of failing to invest in these areas may save a few dollars inside the office, but it costs many multiples of this saving in reduced gross margin.

Poor business processes in scheduling leads to blowouts in travel costs, excessive external purchasing, broken shift allowances, overtime, excess staff and client turnover, scheduling services with over-qualified staff, and excessive phone traffic from staff and clients. It also creates significant rework for Care Managers resolving issues with dissatisfied clients including errors on statements, over-runs on budgets and inconsistent service delivery. Poor scheduling process leads to increased resources needed in care management.
Addressing poor scheduling will give providers a free kick in bringing down care management costs.
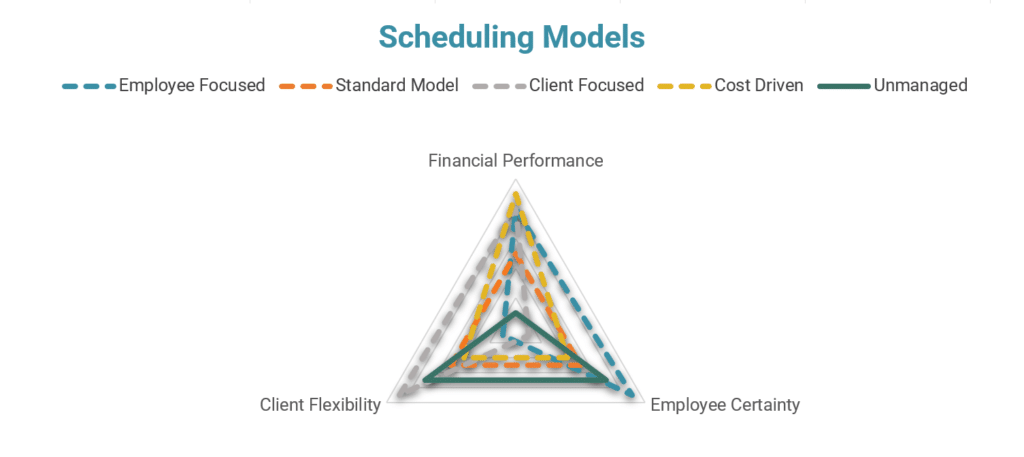
Scheduling in home care is a complex process. It is one of the reasons that home care should not be seen as a labour hire proposition. The chart above shows the three competing objectives of:
The nature of these competing demands is that they are in conflict with each other. In our experience, successful providers acknowledge that they can only outperform in two of the three domains.
Focusing on Client Flexibility & Employee Certainty
For example, to simultaneously provide a lot of certainty for employees and plenty of flexibility to clients, will result in significant unbilled employee time which negatively impacts financial performance.
Focusing on Client Flexibility & Financial Performance
Alternatively, you could seek to provide flexibility for clients, and sustainable profitability by creating a contractor model. This is the approach of the platform providers, however employee certainty is sacrificed.
Once you understand these competing forces, it’s easy to see how when organisations underinvest in scheduling departments, schedulers naturally attempt to please the two key stakeholders they are in contact with on a day-to-day basis – clients and care workers. So, it should be no surprise that a lack of structure to manage this inherent conflict is the root cause of poor financial performance for the organisation.
To make the situation worse, of course, the poor process control means that even for the resources being expended on satisfying these two stakeholder groups, the experience of these groups is still likely to be worse than it should be.
Whilst not a magic bullet, a sound scheduling engine gives home care providers the tools they need to make explicit decisions on where to set the balance between the client’s desire for flexibility, the employee’s desire for certainty and the organisation’s need for sustainable financial performance.
 But the Reform Program is still unknown
Yes it is, however, having led a significant organisation for more than 20 years in an industry that has been subject to ongoing reviews and change, I am yet to see a reform agenda that would cause investment in an efficient scheduling engine to be wasted.
Our advice is that organisations should be taking the opportunity to invest in their central business processes, increase their profitability, and set themselves up on solid foundations for the challenges and opportunities that will be created by the reform program.
A central component of success in the reformed home care sector will be an efficient system for matching clients and staff. Now is the time to act!
If you are struggling with any of the following:
Reach out to our team to find out how we can help with your business model.