
The Aged Care Financial Performance Survey (ACFPS) and the Quarterly Financial Snapshot of the Aged Care Sector (QFS) highlight the percentage of Residential Services operating at a deficit. We recognise that if you want to be successful, imitate successful players. With this in mind, we analysed the key factors of participants in the ACFPS to understand the complex interactions that high performers get right so that our readers can improve their operating performance and sustainability.
In most endeavours, there are a small set of Critical Success Factors that top-quartile performers focus on. In this Insight, we highlight the key measures and, more importantly, the actions you should take to get your measures aligned to successful operators.

 Two financial sustainability pillars
Before getting into how to become a top quartile performer, it is first necessary to understand that there are two pillars that support long-term provider financial sustainability:
![]()
1. How do we optimise financial outcome without sacrificing resident outcome? – This is your business model and
![]()
2. Will our business model support long-term investment in new assets? – This is your return on equity
Every governing body should be continually testing the executive as to whether they have the right business model and whether this business model is delivering a sustainable return on equity. Without a return on equity, over time, the organisation’s capital base is eroded to the point that it cannot renew/update its assets. If this happens, there is no choice but to close or merge. Too often, we see organisations fail to continually reinvest in their infrastructure, despite having significant cash reserves.
If you cannot say you have the right business model, then it’s likely you are in the bottom quartile of performers.
If you do not have a targeted return on equity, this will also likely see you in the bottom 50% of performers.
 External verses internal responsibility
There are persistent loud cries for increased funding to support providers’ EBITDA. As challenging as it may be to admit, the evidence from the data in the above studies confirms that while more funding (Government and/or consumer) is necessary, this alone will not solve the issue of financial sustainability.
To understand this, consider this simple analogy:
When a player or team performs poorly, the coach will focus on what they did poorly rather than blame other external factors. Essentially this comes down to

By focussing on the above factors, future performance is optimised. Some teams become champions, while others keep striving to achieve a performance level they are happy with, and some players call it a day.
There is significant information on what it takes to operate facilities to be sustainable and how much return is required to cause continued investment in the sector. This ultimately leads to a better quality of life for every resident. It might come as a surprise to some, but generally, those who are doing well are invisible.
We suspect that the Health Department and Treasury are aware of the issues with outdated business models and the need for providers to generate an appropriate return on equity. They may have even formed the view that before increasing funding to a level that provides the required long-term return on equity, they want providers to either address their business model issues or exit the sector. This approach would make sense as it means Government will ultimately only fund efficient operators. This optimises the value that residents and taxpayers derive from the sector and allows the Government to provide services to a greater number of consumers.
In summary, having a sustainable aged care service is as much about how the team within your organisation performs, as it is about the level of subsidy you receive. Let’s get into the evidence that we found to support this view.
 Why subsidies alone won’t solve the problem
If subsidies were the driver of differing financial performance of providers, then the surveys would show a high correlation between the level of subsidy received and financial performance.
Table 1 contains a summary of the operating results across the quartiles of the ACFPS.

The variance in EBITDA is 186% and in Operating Result is 315%.
Table 2 compares the care revenue across the quartiles.

Care income only varies by 3%.
Conclusion:
There is no correlation between operating result and the level of care income (subsidy).
 If not care income, then what?
If care income is not the driver of differing financial outcome, this leaves the following options:
 Occupancy
Table 3 shows the occupancy across the quartiles.

There is a significant variance of 8.51% between Q1 and Q4 providers.
We calculated the marginal accommodation income that would accrue to the Q3 and Q4 providers if they could achieve the occupancy of Q2 providers.
Table 4 shows that this has a significant impact on daily income, especially for Q4 providers.

As there is minimal marginal cost associated with this marginal accommodation income, this impact would flow to the bottom line.
Table 5 shows increased occupancy would also result in increased care income.

As Table 6 shows, the marginal care and accommodation income is attributable to a lift in occupancy. Increasing occupancy would have a material impact on the EBITDA and Operating Result of Q3 and Q4 providers.

If the Q3 providers could achieve Q2 occupancy, they would generate positive EBITDA and Q4 providers would reduce their current negative EBITDA by more than 40%.
Conclusion:
Occupancy is a key driver of financial performance.
This raises the question of what meaningful activities are employed by Q1 and Q2 providers that result in higher occupancy? We refer to these activities as the Enquiry Management System (EMS).
From our work with many providers and the qualitative research we have done, we have developed key insights into the critical success factors for maintaining high occupancy. We’re happy to share these if you are interested.
 Other manageable income sources
These are:
As a reader of our Pride Insights, you would be aware of our work with providers in Additional Services. Our view is that unless you incorporate Additional Services in your business model, it is unsustainable. James and Megan are happy to share their thoughts on why Additional Service charges are applicable to all providers for all residents.
The surveys don’t focus on investment income, however, from research we have undertaken, we know that very few providers have appropriate investment policies for RAD that is not deployed into buildings. The long-term average rate for the MPIR is 7%. This means that if you are not earning this on RAD that is not deployed, then this is negatively impacting your operating outcome. We encourage our clients to have a robust Investment Management Strategy (IMS).
While a robust IMS will boost investment income, this involves an additional focus area for providers. In our experience, most boards lack skills in this area. We recommend providers first seek to influence the way residents pay for their accommodation so that it works to the advantage of both residents and the provider and reduces surplus RAD.
Megan has many success stories from her enquiry management training sessions.
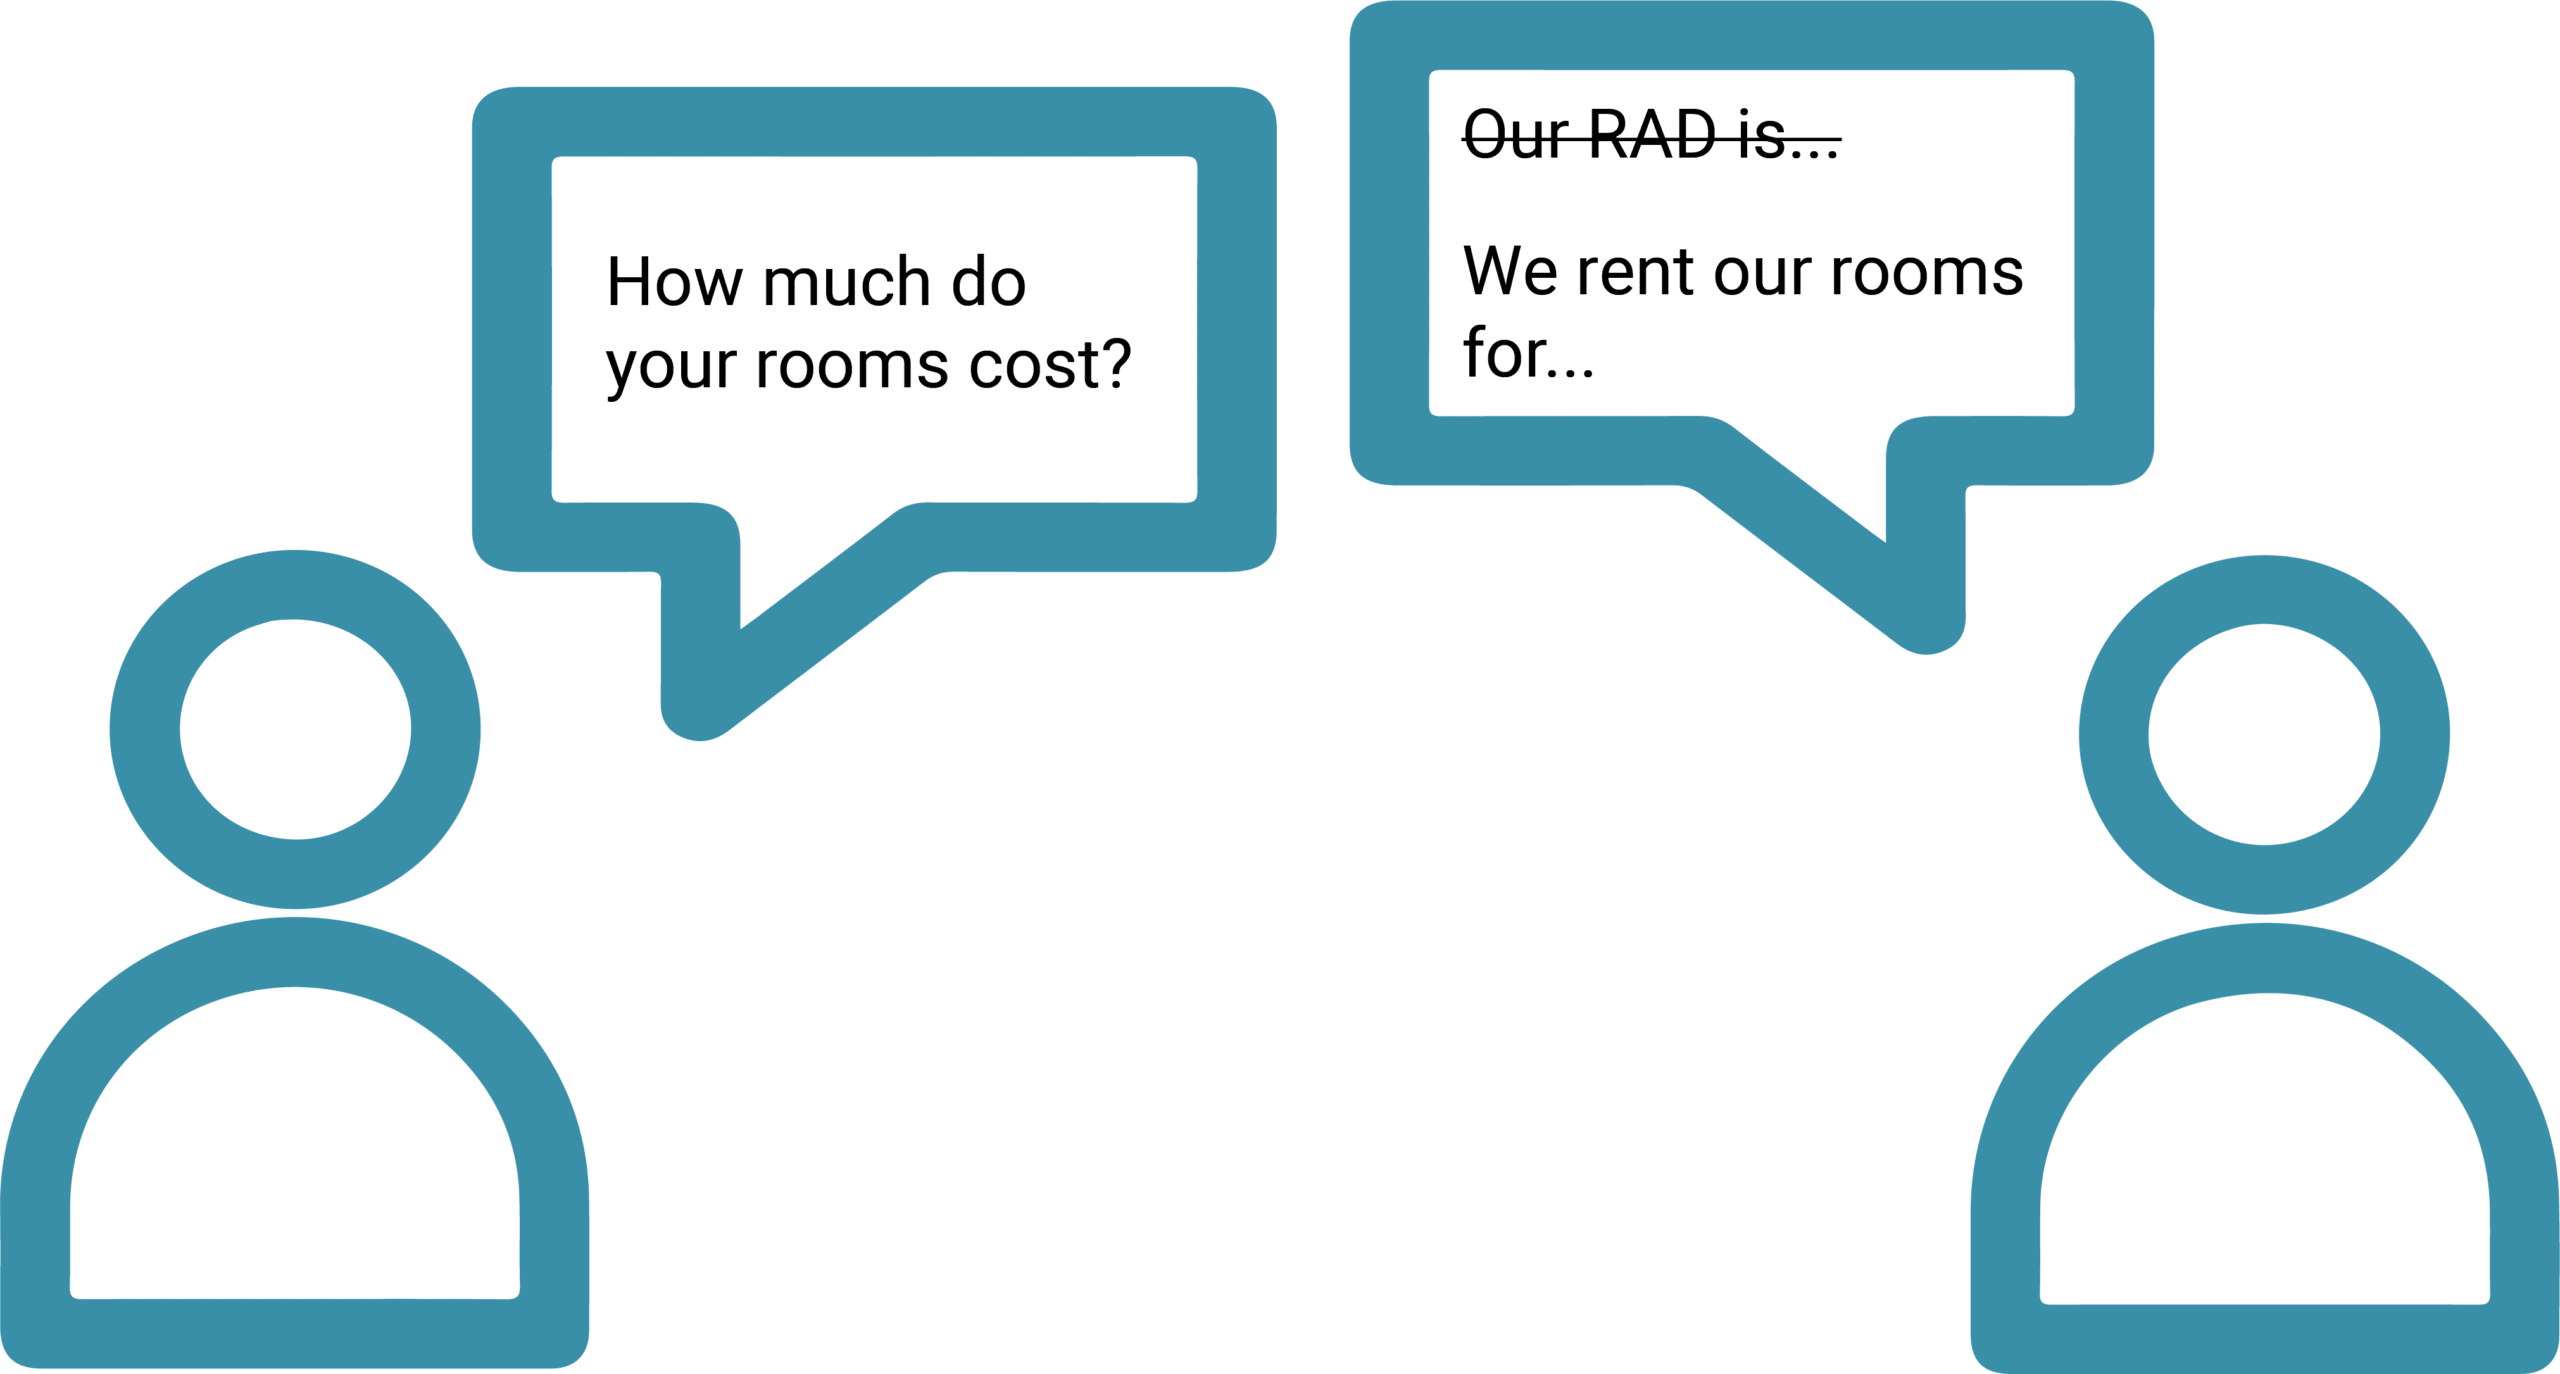
When asked about the cost to come into your facility, instead of answering “Our RAD is”, try saying “We rent our rooms for $X”. If you ask for a RAD, you are likely to get it!
 Resourcing matters
Sustainable business models have always been predicated on a relationship between human resource cost and income. AN-ACC has further strengthened this link with the result that unless a facility generates income from other sources, its financial outcome will be materially impacted if it resources its facilities to a higher level than the subsidy funds.
Table 7 shows the difference in resourcing (care minutes) by quartile:

Table 7 highlights the following:
We work with many providers assessing their resourcing models and can attest that if facilities on Q2, Q3 and Q4 adopted resourcing models similar to those of their Q1 peers, this would materially impact their operating performance.
We have identified three key mistakes that providers with higher resourcing make:
While it’s not possible to be definitive, we suspect the higher resourcing is linked to the lower occupancy.
Conclusion:
The resourcing practices of Q2, Q3 & Q4 materially impact their operating outcome.
 The bottom line
Yes, it’s all about the bottom line. No money, no mission and insufficient return on equity erodes capital.
Table 8 summarises the combined impact of the internally manageable factors on the business models of Q3 and Q4 Providers.

The difference in financial performance is not correlated with a difference in care funding. The difference in business models suggests that players who are achieving substandard performance need to change their game plan.
Last year, we undertook a business model review for a provider and at the conclusion of the assignment, the CFO said:
“So what you are telling us is that we have to become more commercial”
While there is a need for the right level of subsidy, the truth is there will not be a subsidy level that supports inappropriate business models. While we wait for the Government to revise the funding model, there is much that providers can do to improve their results.
 If you’re in the bottom quartile
To support providers, we are conducting a joint webinar series with Sean McKeown from Inside Ageing:
How to improve profitability – Is your model right?
Residential Aged Care: 26th September – 1 pm Sydney/Melbourne time
Home Care: 1st November – 1 pm Sydney/Melbourne time
Here’s the link to register for the events or to find out more:
https://insideageing.com.au/events-how-to-improve-profitability-is-your-model-right/

This upcoming residential aged care webinar will be beneficial if you are struggling with any of the following:
Alternatively, feel free to reach out to our team to find out how we can help with your business model.
In conclusion, welcome to 2023-24 and ideally enhanced sustainability as you seek to provide your services to those in need!