

As you will appreciate, home care organisations are complex, and there are many levers that you can focus on to improve the cash flow and performance of your business. As we’ve worked with clients like you, it has become apparent to us that the issue of pricing is a widely misunderstood area. We’ve helped managers understand the key drivers and avoid common mistakes when setting prices for services, and this has led to increased revenue and sustainability.
The Department of Health and Aged Care has published some important reports on pricing and has made some key policy announcements in recent times. Unfortunately, some of the information can be misleading when making decisions about how to price Home Care Package (HCP) services within your own business.

We trust the following three observations are helpful to you in reviewing and setting your prices:
1. Understanding the published median price
")
The Department publishes the median price (the middle price) charged by home care providers. Many home care providers use this price to set their price, assuming this reflects the average price consumers are prepared to pay.
However, the Department’s median price does not reflect the average price consumers pay. The reason for this is that the median (middle) consumer is not serviced by the median organisation. We know that 40% of home care subsidies go to the largest 25 providers. When we reviewed the published prices of these 25 providers, we found their prices tended to be above the median as published by the Department.
From this, we conclude that the median consumer is paying significantly more than the median price as published by the Department. This means there are many organisations who believe they are charging market rates when they are actually well below market.
The following graph shows the spread of consumer cost for a simple basket of services on a Level 4 package.
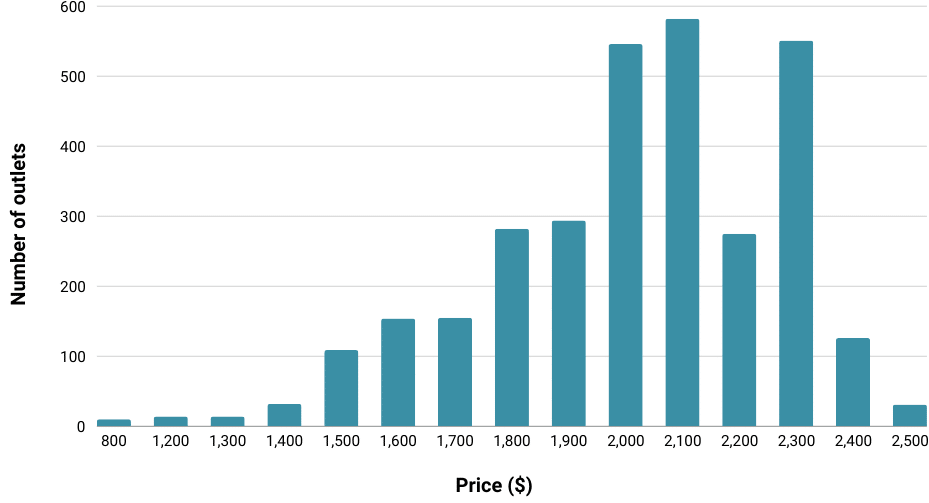
There are a lot of people paying $2,000 – $2,300. You can see on this graph that it is not the expected bell shape. There are two clusters of prices. Those that are around the published median price, and those that appear to be around the median consumer price. This graphically displays the different approaches taken by organisations in analysing pricing data.
Takeaway: Understanding where you sit in comparison to your competitors’ pricing policies can help optimise your financial performance and marketing mix decisions.
2. The interplay between fixed and hourly charges
It’s difficult to compare prices across the industry because organisations employ different pricing strategies. Some organisations choose to charge below the maximum Program Management and Care Management prices and have higher hourly rates. Others use high Program and Care Management prices with relatively low hourly rates. If these organisations compare themselves on either but not both of these metrics, they will get a distorted view of their relative market positioning. Even worse, they can be vulnerable to consumers cherry-picking where they are more expensive and can suffer pressure on margins.
This misunderstanding often infects the sales messaging within the organisation. Where this occurs, it tends to result in lost cash flow and revenue growth. In a recent assignment, a large organisation appeared to be relatively cheap because of the low hourly rate; however, when their Program and Care Management fees were taken into account, their charges reflected the median consumer price.
Takeaway: The key metric is the average hourly cost of a basket of services including Program and Care fees.
3. Department policy regarding outsourced services
The Department’s advice on pricing outsourced services is that reasonable markups can be charged subject to some administrative hurdles. In our opinion, this allows providers to earn some margin on outsourced services relating to the administration in managing these activities.
Many organisations misunderstand the Department’s advice. This means the organisation is foregoing accessible cash flow and marginal surplus.
Takeaway: Pricing policies for outsourced services are a direct and easy way to increase cash flow.
Share of wallet and average client spend
In retailing, it’s called ‘average basket size,’ and the store layout is designed to encourage you to add more items to your basket. In a home care context, your revenue and therefore your operating outcome are a function of:
1
Number of
clients
2
Average number of services
consumed by clients
3
Average charge
per service
4
Weighted average
package value
5
Average Program and
Care service charges
6
Average consumer
contribution
The three observations relate to points 3 and 5. These are policy-based and are the easiest levers to manipulate. Focusing on these will materially impact your operating performance. Once our clients are on top of these policy areas, we then focus on the more challenging behavioural aspects of points 1, 2, 4, and 6.
Once you understand how to manipulate the key levers, your organisation will truly be on the path of sustainability.
Takeaway: Pricing increases are the quickest and easiest way to achieve increased margin. Mispricing services is costing many organisations money that could be reinvested in service delivery.
At Pride Living, we’ve developed a comprehensive method of assessing and advising organisations on their pricing matrix. Where clients have adopted our recommendations, they have benefited from significant revenue and profit increases on their existing clients and in some cases turned loss-making operations into profit centres.
Get in touch for a no-obligation 30-minute consultation to explore how we can address your challenges with our approach.