
If the risks are known, why is being compliant the exception rather than the norm?
This is our fourth analysis into the non-complaint and sanctioned facilities, building on the Commission’s quarterly sector performance data.
For this Insight, we sought some feedback from our network – a particular thanks to Steve Tuelan, Chair of Catholic Healthcare and Cindy Woods, CEO of St. Luke’s Care for some inspiration.
Again, we see another increase in the non-compliances issued. As we have noted from the beginning of conducting these insights, the risks of non-compliances are known and stable and the changes to the type of non-compliances are relatively minimal.
So if the risks to non-compliances are known, why do non-compliances continue to increase in occurrence?


We analysed on how some Providers seem to be ‘getting it right’ and if there are any characteristics that assist in this.
But first, let’s do a quick review of the compliance landscape.
![]()
Compliance Landscape – Non-Compliant Facilities
Audit Activity – comparing the four quarters of 2021:
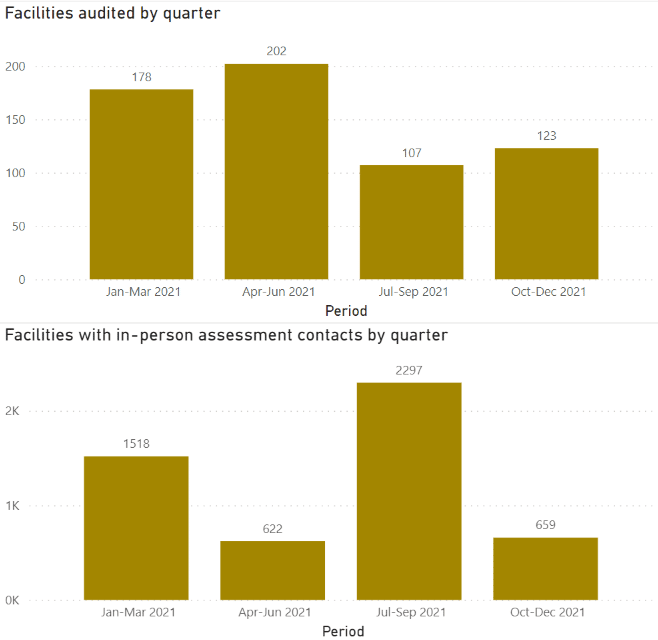
🔍 There was a significant drop in audit activity between the 2nd and 3rd quarter due to COVID, however, there is now a steady increase.
You can expect this increase to continue in 2022, as we know the Commission intends for a return to normal activity and has even outsourced external auditing parties.
🔍 There was an increase in Assessment contacts in the 3rd quarter
This increase may be attributed to desktop audits and infection control monitoring assessment activities by the Commission.
🔍 High chance visits remain for facilities that have not received any audits or A/Cs in the last few quarters
Especially if you received a COVID extension to your accreditation expiry in the past… prepare for a visit.
🔍 The Commission is continuing to prioritise high-risk sites using their internal risk matrix through SIRS and NQIP data
As we’ve mentioned in our last non-compliance data analysis, there’s a risk that Providers have reduced their testing for compliance due to COVID and reduced audit activity by the Commission.
Characteristics of the non-compliant facilities (Jul-Dec 2021)
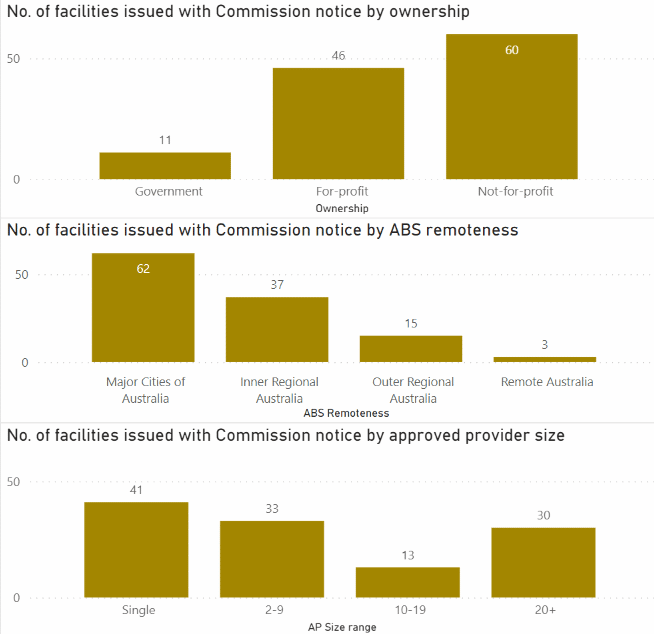
🔍 There was a significant rise in non-compliant for-profit providers
While we see the not-for-profit providers in this quarter having the most non-compliance out of the three categories, there is a significant rise in the for-profit providers.
🔍 There is continued impact in facilities located in major cities over remote facilities
A Provider’s location is not an indicator of non-compliance
🔍 Significant rise in Commission notice based on approved provider size (Single operator)
We dig deeper on whether size is an indicator to non-compliance below.
![]()
Digging deeper – Facilities by size
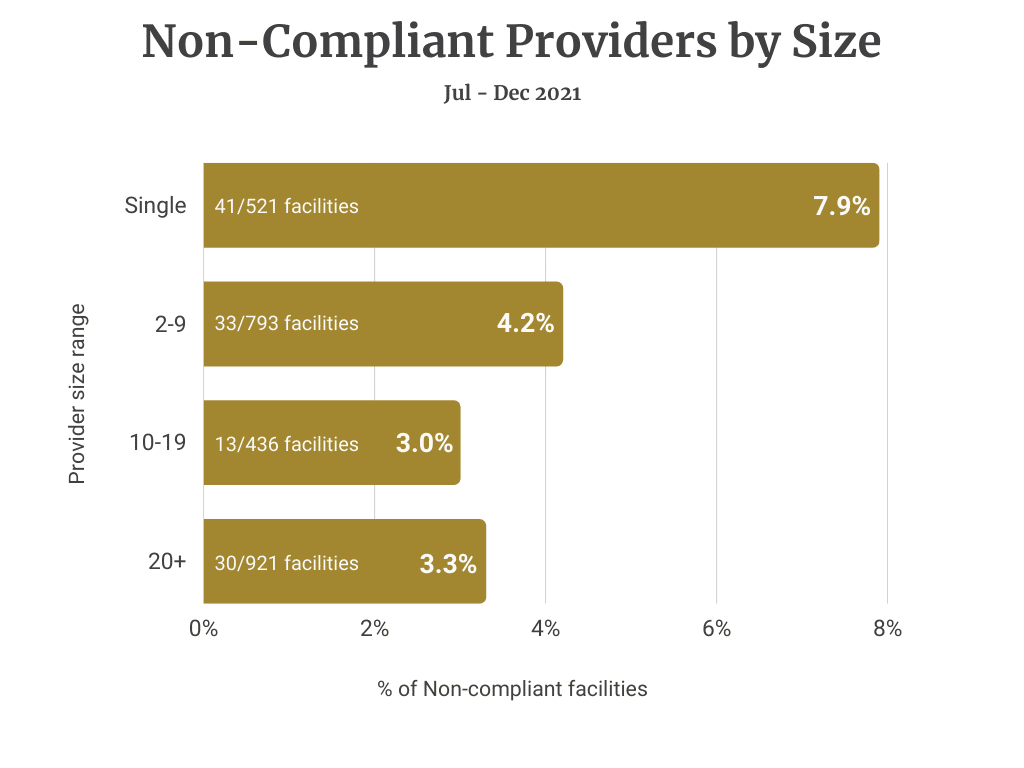
With the disclaimer that some of the analyses are based on data-driven assumptions given audit sampling, we stratified the breakdown by size.
We can infer that larger corporations, despite their systems and processes are not immune to non-compliances.
However, the chart below shows that of the 20+ group who operate a total of 921 facilities, only 30 were non-compliant. That’s 3.3% compared to the single providers’ rate of 7.9%.
Hence, a facility operated by a larger organisation is less likely to be non-compliant.
We have heard a few comments from our clients and contacts that the industry has been generous in sharing their knowledge and expertise, particularly in the management of outbreaks.
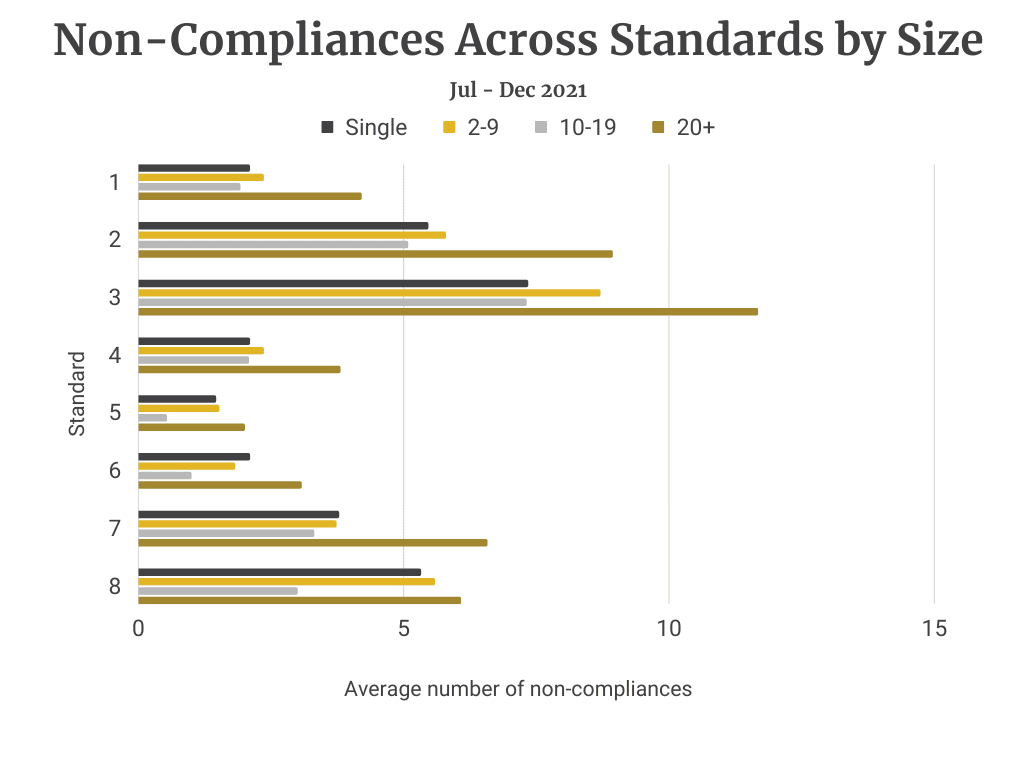
We also calculated the average no. of non-compliances across each standard by size.
Standard 3 remains the dominant non-compliance in all provider size categories.
![]()
Compliance Landscape – Standards & Requirements
Non-compliance by standard and requirement (Jul-Dec 2021)
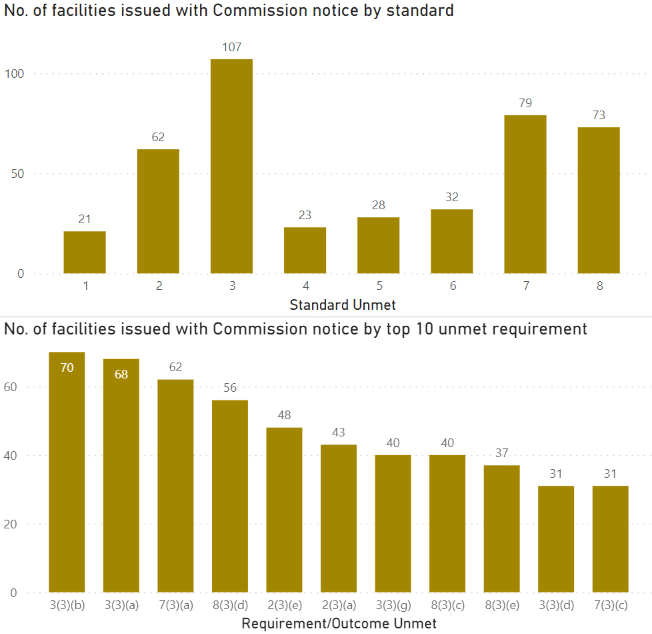
🔍 At least 117 homes were deemed non-compliant
🔍 High failure rates remain focused in Standard 3, 8 and 7
🔍 Link between 3, 8 and 7
While shortcomings in Standard 8 (Organisational Governance) and Standard 7 (Human Resources) of themselves are less likely to lead to a non-compliance, they are indicative that governance practices relating to Standard 3 are likely to be below best practice.
🔍 Importance in maintaining compliance in Standard 1 and 4
Even if they are the lowest standards in non-compliance.
🔍 4th quarter – issuing non-compliances under new legislation of restrictive practice and incident management
This is separate to the ACQS. We discuss this further below.

Non-Compliance Notices relating to the Aged Care Act
It’s also worthwhile to note that the Commission issues non-compliance notices for failure to comply with the Aged Care Act.
There are three possible types of non-compliances in this category:

Rate of Non-compliance by Standard and Requirement
Order of rate of non-compliance by Standard
1. Standard 3 – Personal care and clinical care![]()
![]() 2. Standard 7 – Human resources
2. Standard 7 – Human resources
![]() 3. Standard 8 – Organisational governance
3. Standard 8 – Organisational governance
![]() 4. Standard 2 – Ongoing assessment and planning with consumers
4. Standard 2 – Ongoing assessment and planning with consumers
![]() 5. Standard 5 & 6 – Organisation’s service environment and Feedback and compliants
5. Standard 5 & 6 – Organisation’s service environment and Feedback and compliants
![]() 6. Standard 1 & 4 – Consumer dignity and choice and Services
6. Standard 1 & 4 – Consumer dignity and choice and Services
and supports for daily living
The top 10 detailed requirements are:
1. 3(3b) High impact or high prevalence risks managed effectively![]()
![]() 2. 3(3a) Safe and effective personal and clinical care
2. 3(3a) Safe and effective personal and clinical care
![]() 3. 7(3a) Number and mix of workforce
3. 7(3a) Number and mix of workforce
![]() 4. 8(3d) Risk management systems and practices
4. 8(3d) Risk management systems and practices
![]() 5. 2(3e) Regular reviews of care and services
5. 2(3e) Regular reviews of care and services
![]() 6. 2(3a) Safe and effective care and services
6. 2(3a) Safe and effective care and services
7. 3(3g) Infection control![]()
![]() 8. 8(3c) Effective governance systems
8. 8(3c) Effective governance systems
![]() 10. 8(3e) Clinical governance framework
10. 8(3e) Clinical governance framework
9. 3(3d) Recognition and response to deterioration ![]()
and
7(3c) Competent workforce with qualifications and knowledge![]()

Key Focus Areas to Minimise Non-compliance
The top 10 non-compliances reflect the Commission identifying ineffective Clinical Governance and Risk Management systems throughout the sector.
In our experience, the larger the organization, the more removed executives and the board tend to be from the impact of clinical and risk management failures within the facilities. The focus really needs to be placed on onsite key personnel to drive clinical leadership on the ground as this has a direct impact on the resident care and driving the values of the organisations at the coalface.
The five key areas of focus to minimize non-compliance:
Interactive online report
Below is an interactive online report that allows you to conduct your own analysis with the data found for the period July – December 2021:
Here is the previous non-compliance data for the period January – June 2021 to compare:

We’re here to help
The goal for providers is to improve their clinical governance and risk management to ensure the delivery of quality care to their residents. We all know prevention is better than cure, which is why mock assessments and an independent review are great in helping your staff prepare and build confidence to respond to site audits and assessment contacts as they occur.
Our Quality and Compliance team are here to assist you to build internal capability and provide an external objective perspective where this is appropriate.